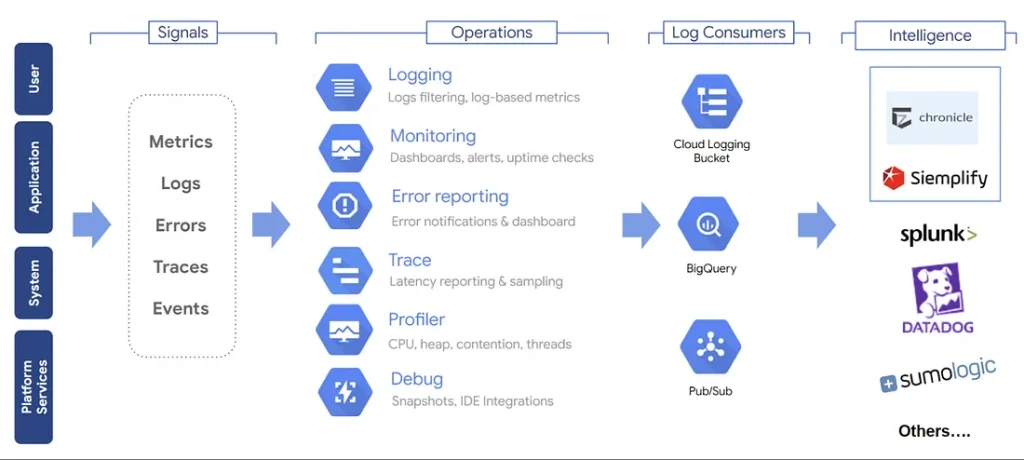
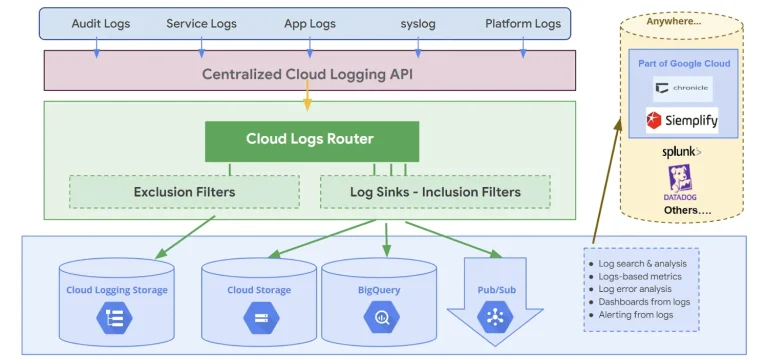
In modern cloud-native environments, the era of siloed metrics and logs is fading. What’s essential now is a unified, context-rich approach that seamlessly blends observability with traceability. Google Cloud’s operations suite—backed by native OpenTelemetry support and a resource-centric model—lays the groundwork for this integration.
For organizations running Docker workloads, leveraging this suite is key to achieving faster incident resolution, optimized performance, and resilient operations.
This article offers a hands-on guide to building actionable observability for Docker workloads on Google Cloud. We’ll explore how to effectively use Cloud Monitoring, Cloud Trace, and the broader observability stack to unlock deep insights, capitalize on GCP’s unique strengths, and apply best practices for reliability and scalability in real-world deployments.

The Challenge: Unifying Signals in a Cloud-Native Ecosystem
As cloud-native architectures evolve, teams often start with a mix of observability tools—Prometheus for metrics, Loki or Cloud Logging for logs, and Jaeger or Cloud Trace for distributed tracing. While this patchwork setup can function, it often leads to context-switching and manual correlation during outages, slowing down resolution and complicating root cause analysis.
With Docker workloads becoming ubiquitous and migrations to Google Cloud accelerating, what’s needed is seamless, context-aware observability—where signals are not just collected but meaningfully connected.
Google Cloud’s observability suite—Cloud Monitoring, Cloud Logging, and Cloud Trace—offers this integration. But to unlock its full potential, teams must understand its unique strengths, including resource labeling, workflow integration, and OpenTelemetry-native support.
Google Cloud Observability: A Unified Approach
Google Cloud Observability is a comprehensive suite designed to collect, correlate, and analyze telemetry data across applications and infrastructure. It includes:
- Cloud Monitoring: Real-time metrics, dashboards, alerting, and SLO management.
- Cloud Logging: Centralized log ingestion, querying, and analytics.
- Cloud Trace: Distributed tracing for latency and dependency analysis.
- Cloud Profiler & Debugger: Live performance profiling and debugging.
- Managed Service for Prometheus: Kubernetes-native metrics collection and querying.
These services are enabled by default in new GCP projects, offering out-of-the-box dashboards, preconfigured alerts, and tight integration with GCP resources—making it easier to build a unified observability pipeline from day one.
Deep Dive: Cloud Monitoring on Google Cloud
Cloud Monitoring serves as the central hub for visibility across your Google Cloud environment. It aggregates metrics, events, and metadata from GCP services, custom applications, and even hybrid or multi-cloud setups—giving teams a unified view of system health and performance.
Key Capabilities
- Automated Metric Collection
Most GCP services emit metrics automatically. For virtual machines, the Ops Agent handles both logging and metrics. In Kubernetes environments, Managed Service for Prometheus provides native metric collection and querying. - Custom Metrics
Developers can instrument applications to expose custom metrics—whether business KPIs or application-specific signals. These are ingested alongside system metrics, enabling deeper insight into workload behavior. - Dashboards
Cloud Monitoring offers pre-built dashboards for GCP services and supports rich customization. Dashboards can span multiple projects, clusters, or resource groups, and include advanced visualizations for real-time analysis. - Alerting & SLO Monitoring
Alert policies can be configured for any metric, with support for static and dynamic thresholds. Notifications can be routed via email, SMS, Slack, PagerDuty, and more. Service Level Objectives (SLOs) can be inferred or manually defined, aligning with SRE best practices. - Uptime & Synthetic Monitoring
Monitor the availability of URLs, APIs, and load balancers using global probes. Alerts can be triggered on outages or performance regressions, helping teams catch issues before users do. - Integrated Logging & Tracing
Cloud Monitoring seamlessly links to Cloud Logging and Cloud Trace, allowing engineers to drill down from a metric anomaly to the corresponding logs or traces—accelerating root cause analysis and resolution.

Example: Setting Up Cloud Monitoring for Docker Workloads
Setting up observability for Docker workloads on Google Cloud is straightforward when you follow a structured approach. Here’s a step-by-step guide to help you build a robust monitoring pipeline:
- Enable Cloud Monitoring
Start by enabling the Cloud Monitoring API for your GCP project. This activates the core observability services and prepares your environment for telemetry collection.
- Deploy Monitoring Agents
- For Compute Engine VMs, install the Ops Agent, which handles both logging and metrics.
- For GKE clusters, use the Managed Service for Prometheus to collect Kubernetes-native metrics.
- Instrument Your Applications
Use OpenTelemetry or GCP-supported client libraries to expose custom metrics from your applications. These can include business KPIs, latency, error rates, or any domain-specific signals.
- Build Dashboards
Create custom dashboards to visualize key metrics such as CPU usage, memory consumption, request latency, and error spikes. Dashboards can span multiple projects and clusters for centralized visibility.
- Configure Alerts
Set up alerting policies for critical thresholds. For example:
- High latency
- Elevated error rates
- Resource exhaustion
Alerts can be routed to email, Slack, PagerDuty, or other incident response tools.
- Monitor SLOs
Define and track Service Level Objectives (SLOs) to measure reliability. Use these to trigger alerts when performance deviates from expected standards, aligning with SRE best practices.
Unified Observability: Cloud Monitoring and Trace in Action
One of Google Cloud’s standout strengths is the tight integration between Cloud Monitoring, Logging, and Trace. This interconnected observability stack enables teams to move seamlessly from detection to diagnosis—without the friction of switching tools or losing context.
Why This Matters
- From Metrics to Root Cause: Spot an anomaly in your dashboard? You can drill directly into the related traces, and from there, jump into the exact logs that explain what went wrong.
- SLO-Driven Alerting: Alerts based on Service Level Objectives (SLOs) can automatically guide engineers to the relevant traces and logs, accelerating incident response.
- Unified Dashboards: Combine metrics, traces, and log-based metrics on a single dashboard for a holistic, end-to-end view of your system’s health.
Sample Incident Workflow
Here’s how this unified workflow plays out in a real-world scenario:
- Latency Spike Detected
A spike appears on your Cloud Monitoring dashboard for a key service. - Trace Investigation
You drill down into Cloud Trace to identify slow spans or bottlenecks in the request path. - Log Correlation
From the trace, you jump directly into Cloud Logging to find error messages or contextual clues. - Resolution & Verification
After applying a fix, you monitor the metrics and traces to confirm the issue is resolved.
Advanced Monitoring Features & Edge Cases
Multi-Project & Multi-Region Visibility
Cloud Monitoring supports cross-project dashboards and alerts, ideal for organizations running microservices across multiple GCP projects or hybrid environments. You can roll up metrics across clusters, zones, and regions for centralized SRE visibility.
High-Cardinality & Resource-Centric Analysis
GCP’s resource labeling allows for fine-grained filtering by attributes like pod, container, region, or version—especially useful in dynamic environments like GKE where workloads are short-lived and frequently rescheduled.
Synthetic Monitoring & Blackbox Probes
You can configure synthetic checks to monitor not just public endpoints, but also internal APIs, load balancers, and GKE ingress controllers—catching issues that might not surface in application metrics alone.
Monitoring at Scale
At high scale, Cloud Monitoring can ingest millions of time series per minute. To avoid cardinality explosions and cost overruns:
- Use metric filters and aggregations wisely.
- Limit custom and log-based metrics to meaningful signals.
- Monitor the observability pipeline itself for ingestion delays or dropped data.
Cloud Trace: Real-Time Latency Insights
Cloud Trace is Google Cloud’s distributed tracing system, inspired by Google’s internal Dapper architecture. It provides near real-time visibility into how requests flow through your microservices, containers, and managed services—making it easier to pinpoint latency hotspots and optimize performance.
How Cloud Trace Works: Under the Hood of GCP’s Distributed Tracing
Google Cloud Trace is a powerful tool for understanding latency and performance across distributed systems. It captures how requests flow through services, helping teams pinpoint bottlenecks and optimize performance. Here’s a breakdown of how it works and what makes it effective:
Core Components of Cloud Trace
Component | Function |
Instrumentation Libraries | Use OpenTelemetry SDKs (Java, Python, Node.js, Go, etc.) to generate spans in your application code. |
Ingestion API | Accepts trace data from instrumented apps or agents and sends it to GCP. |
Trace Storage | Efficiently stores and indexes trace data for fast querying and analysis. |
Analysis Tools | GCP Console and APIs provide rich filtering, comparison, and visualization. |
Sampling Mechanisms | Adaptive sampling balances cost and data coverage for high-throughput apps. |
Key Features of Cloud Trace
- Latency Breakdown
Visualize where time is spent across services, down to individual spans. - Trace Explorer
Filter and search traces by service, endpoint, region, or custom attributes. - Deep Integration
Works natively with GKE, App Engine, Cloud Run, and other GCP services. Automatically correlates with logs and metrics. - Performance Insights
Analyze latency distributions and identify performance bottlenecks automatically. - Exemplars
Link outlier metric values (e.g., high latency) directly to the traces that caused them—bridging the gap between metrics and traces. - BigQuery Export
Store trace data in BigQuery for long-term retention and advanced analytics.
Example: Instrumenting a Dockerized Python Service
To get started with Cloud Trace in a Dockerized Python app:
- Add the OpenTelemetry Python SDK to your application.
- Configure the exporter to send trace data to Google Cloud.
- Wrap key functions or endpoints with spans to capture latency.
- Deploy the container to GKE, Cloud Run, or Compute Engine.
- View traces in the Cloud Trace Explorer and correlate them with logs and metrics.
Cloud Trace in Action
- Enable the Cloud Trace API in your GCP project.
- Instrument your application using OpenTelemetry SDKs.
- Deploy the application to GKE, Cloud Run, or Compute Engine.
- View traces in the Cloud Console to analyze request flows, latency, and dependencies.
- Set up alerts for latency anomalies or SLO violations using integrated alerting.
Advanced Applications & Best Practices for Observability on Google Cloud
As observability matures within cloud-native environments, teams must go beyond basic metrics and logs. Google Cloud’s observability stack offers powerful capabilities that, when used strategically, can transform how organizations monitor, respond, and optimize their systems.
Best Practices for Effective Observability
Customized Dashboards
Tailor dashboards for different stakeholders:
- SREs: Focus on latency, error rates, and SLO compliance.
- DevOps: Highlight infrastructure health, deployment metrics, and resource usage.
- Business Teams: Surface KPIs like user activity, transaction volume, and conversion rates.
Use Cloud Monitoring’s rich visualization tools to build role-specific views that drive actionable insights.
Smart Alerting Policies
Avoid alert fatigue by:
- Defining severity levels for alerts.
- Using dynamic thresholds based on historical baselines.
- Configuring multi-channel notifications (Slack, PagerDuty, email) for timely response.
SLO Monitoring
Track service reliability using Service Level Objectives. Automate remediation or escalation workflows when SLOs are breached, aligning with SRE principles.
Security Posture Monitoring
Integrate logs and metrics to detect:
- Unauthorized access attempts
- Configuration drift
- Suspicious behavior across services
Use Cloud Logging and Monitoring to build security dashboards and alerts.
Hybrid & Multi-Cloud Observability
Use the OpenTelemetry Collector to ingest telemetry from AWS, on-prem, and GCP environments. Normalize metadata to enable consistent analysis across platforms.
Cost Optimization
Treat cost as a first-class metric:
- Track unit economics (e.g., cost per request or user).
- Prioritize metrics that help reduce resource waste.
- Use dashboards to visualize cost trends and optimize usage.
Handling Edge Cases in GCP Observability
High-Cardinality Metrics
In large GKE clusters or multi-tenant setups, labels like pod name, container ID, or customer ID can cause cardinality explosions, impacting performance and cost.
Mitigation Tips:
- Use label filters and aggregations in dashboards and alerts.
- Limit custom metrics to essential business and operational signals.
- Regularly clean up unused labels and metrics.
Observability in Ephemeral & Serverless Workloads
Services like Cloud Run and Cloud Functions pose challenges due to their transient nature.
Best Practices:
- Ensure context propagation in stateless calls.
- Scale OpenTelemetry Collectors to match workload burstiness.
- Optimize retention policies for logs and traces in high-churn environments.
Monitoring the Monitoring Pipeline
At scale, the observability pipeline itself can become a bottleneck. Use self-monitoring metrics (e.g., dropped spans, ingestion latency) from Cloud Monitoring and OpenTelemetry Collector.
Recommendations:
- Create dashboards for pipeline health.
- Set alerts for ingestion delays or data loss.
- Proactively detect silent failures before they impact visibility.
Why Bridging Traceability and Observability Matters
A well-designed observability pipeline in GCP enables:
- Fast root cause analysis through seamless transitions between metrics, logs, and traces.
- Granular insights with high-cardinality, context-rich telemetry—even in transient or serverless environments.
- Cost-effective operations via smart sampling, batching, and enrichment at the Collector layer.
- Unified incident response with trace exemplars, correlated logs, and actionable metrics—reducing time to resolution and boosting reliability.
As workloads become increasingly containerized and distributed, bridging traceability and observability isn’t just a technical advantage—it’s a foundational strategy for building scalable, resilient systems on Google Cloud.


